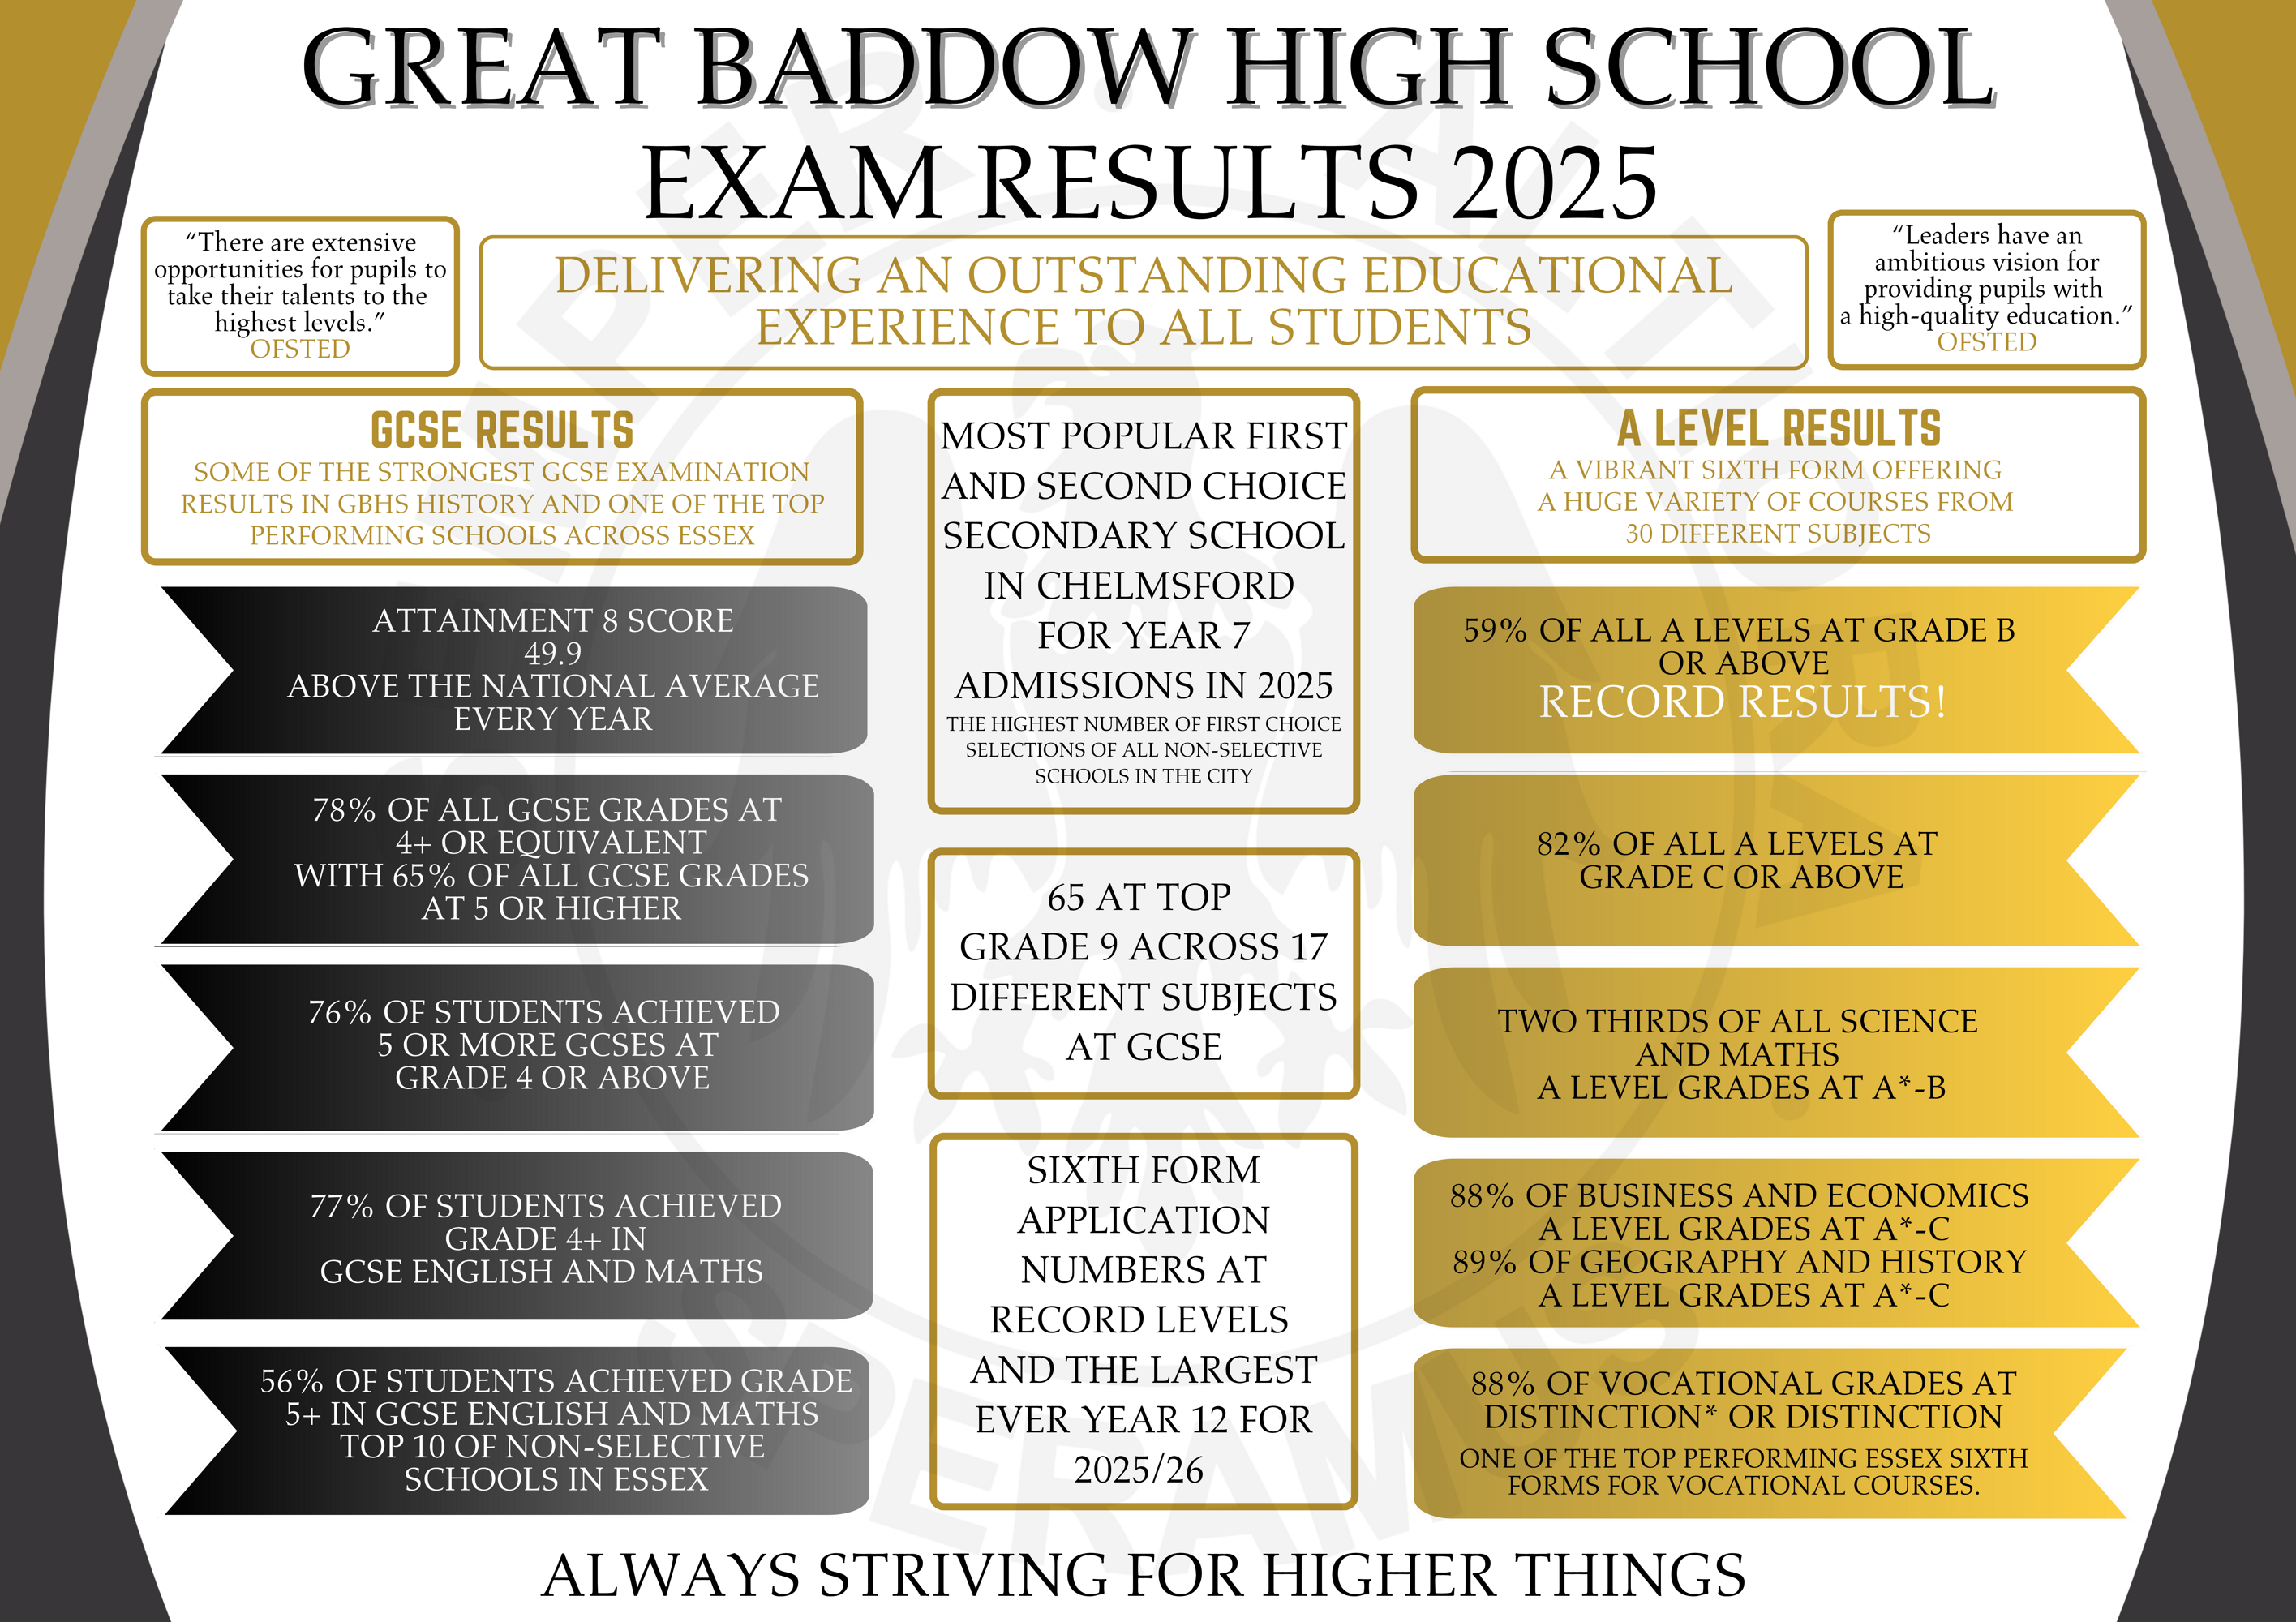
Exam Results & School Performance Tables

Performance Data: KS4 (2025)
| Progress 8 score for 2024 (No progress figure calculated in 2025) |
+0.03 |
|---|---|
| Attainment 8 score |
49.8% |
| % of students achieving a strong pass (Grade 5 or above) in English and mathematics |
56%
|
| % of students entering for the EBacc | 24.9% |
| EBacc average point score | 4.33 |
| the percentage of students staying in education or going into employment after key stage 4 | 95% |
Progress 8 Score:
This score shows how much progress pupils at this school made between the end of key stage 2 and the end of key stage 4, compared to pupils across England who got similar results at the end of key stage 2.
A score above zero means pupils made more progress, on average, than pupils across England who got similar results at the end of key stage 2.
Attainment 8 Figure:
Attainment 8 measures a student's average grade across their best eight subjects – the same subjects that count towards Progress 8.
A student’s Attainment 8 score is calculated by adding up their points for their best eight subjects, double counting their best English and maths results. This is then averaged across the whole cohort to get the Attainment 8 score.
Performance Data: KS5 (2025)
|
The progress students have made compared with students across England |
A Levels/Academic +0.07
|
|---|---|
| The average grade students get at KS5 |
A Levels/Academic B-
Tech Level - Dist+ |
|
Student retention (retained and assessed 2024) |
98% |
|
Student destinations |
86% Further Education, Employment or apprenticeship more than two terms after leaving (data captured from 2023 leavers). |
School Performance Tables
 Examination Results
The Department for Education publish Schools Performance Tables yearly.
View the latest tables below.
Examination Certificates.
If you need replacement GCSE or A-Level certificates from the exam boards you should follow the link below:


